1) What “sound pressure” actually is
Sound in air is a tiny, rapid fluctuation of air pressure around the normal atmospheric pressure.
- Atmospheric pressure is about 101,325 Pa.
- Typical audible sound pressure fluctuations are only fractions of a Pascal.
- Your ear senses these fluctuations; a microphone measures them.
Sound pressure measurement means measuring these pressure fluctuations and expressing their strength as a Sound Pressure Level (SPL) in decibels (dB).
2) Why decibels (dB) are used
Sound pressures vary over a very wide range. Using a linear scale (Pascals) is inconvenient, so we use a logarithmic scale (dB).
SPL is defined relative to a reference pressure:
- Reference pressure in air: 20 µPa (micropascals), approximately the threshold of human hearing at 1 kHz.
The basic SPL formula is:
Key point:
- RMS (“root mean square”) is used because sound is a changing waveform; RMS represents an “effective” steady value that correlates with acoustic energy.
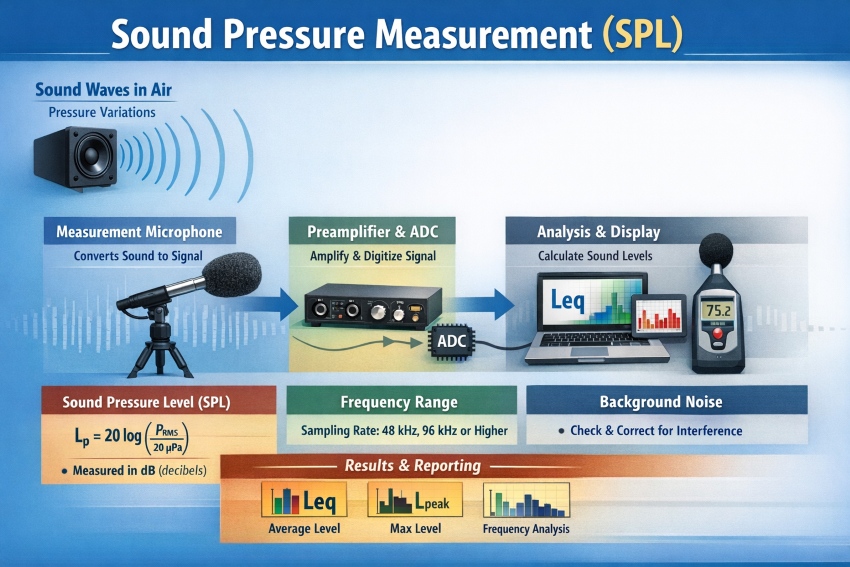
3) The measurement chain: how pressure becomes a number
Sound pressure measurement is essentially a controlled conversion process:
Step 1 — Sound wave in air
A sound source creates pressure variations at your measurement point.
Step 2 — Microphone converts pressure → electrical signal
A microphone diaphragm moves with pressure changes.
- That motion is converted into a voltage (or charge/current) proportional to pressure.
A measurement microphone is designed to be predictably accurate, with a documented frequency response.
Step 3 — Preamplifier conditions the signal
The microphone output is small and needs:
- Amplification (gain)
- Impedance matching
- Stable powering (depending on mic type)
Step 4 — Analog-to-digital conversion (ADC)
If you record digitally, the conditioned analog signal is sampled and quantized:
- Sampling rate (e.g., 48 kHz, 96 kHz)
- Bit depth (e.g., 24-bit for good headroom and noise performance)
Step 5 — Digital processing computes SPL metrics
Software (or a sound level meter’s internal processor) computes:
- RMS pressure level over time (SPL)
- Averages (Leq)
- Peaks (Lpeak)
- Frequency analysis (FFT or octave bands)
- Optional weighting (A, C, Z)
This final step produces the reported result in dB.
4) What a “sound level” result really means (common metrics)
Different questions require different metrics. The instrument is often measuring the same waveform, but reporting different summaries.
4.1 Instantaneous SPL (momentary level)
A short-time RMS level. Useful for quick readings, but can fluctuate.
4.2 Leq — Equivalent continuous sound level
Leq is the most common “overall noise” metric. It is an energy average over a defined time window.
- Example: Leq over 60 seconds tells you the single steady level that would contain the same acoustic energy as the varying sound over that minute.
4.3 Lmax / Lpeak
- Lmax: maximum RMS level observed (depends on time constant)
- Lpeak: maximum peak level (captures very fast impulses)
5) Sampling frequency for accurate high-frequency measurement
To measure higher frequencies correctly, two limits matter:
5.1 Nyquist limit (digital sampling rule)
To represent a frequency , you need:
Examples:
- To measure up to 20 kHz, you need at least 40 kHz sampling → 48 kHz minimum is common.
- For better margin and cleaner filtering, 96 kHz is often preferable for high-frequency work.
5.2 Practical limit: the whole measurement chain must support it
Even if sampling rate is high, you also need:
- Microphone with flat/known response up to that frequency
- Preamplifier bandwidth adequate for that frequency range
- ADC with proper anti-alias filtering
Recommendation (typical):
- Up to 10 kHz: 48 kHz sampling is usually sufficient.
- Up to 20 kHz: 48 kHz can work, but 96 kHz is safer for accuracy near the top end.
- Above 20 kHz: you need specialized microphones and hardware; 96–192 kHz sampling may be required.
6) Microphone type: what to use and why
For reliable SPL work, use a calibrated measurement microphone, not a general studio/vocal mic.
6.1 Free-field vs pressure vs random-incidence (the “correctness” issue)
Measurement microphones are designed for different sound fields:
- Free-field microphone (most common recommendation)
Best when the mic points toward the source in open air or typical measurement setups. Designed to compensate for the mic’s presence in a free field. - Pressure microphone
Best for couplers, cavities, or flush mounting. Not the default choice for general room measurements. - Random-incidence microphone
Useful in diffuse/reverberant fields where sound arrives from many angles.
If you do not have a specific reason otherwise, a free-field measurement microphone is typically the best general choice.
6.2 Microphone size: 1/2-inch vs 1/4-inch (high-frequency trade-off)
Smaller diaphragms generally perform better at high frequencies.
- 1/2-inch
Pros: good sensitivity, lower self-noise, robust general-purpose choice
Cons: typically less ideal at the extreme high-frequency end - 1/4-inch
Pros: better high-frequency response (useful approaching/above ~20 kHz)
Cons: usually higher self-noise and lower sensitivity; requires careful gain/noise management
Practical guidance:
- If your priority is low noise floor (quiet environments) and typical audible-band measurements: 1/2-inch is often ideal.
- If your priority is high-frequency accuracy near the top of the audible range or beyond: 1/4-inch can be advantageous.
7) Background noise: why it can distort your results
Background noise matters because sound levels add by energy, not by simple arithmetic.
If your measured level includes both the source and the background, your reading is:
- Too high compared to the source alone.
- The error grows when the source is close to the background level.
7.1 A practical rule (signal-to-background margin)
- If total level is ≥ 10 dB above background: background influence is usually small.
- If it is 3–10 dB above: background meaningfully affects the result.
- If it is < 3 dB above: the measurement is dominated by background and is often not reliable.
7.2 Background correction (when you can measure background separately)
Measure:
- : source ON
- : source OFF (background)
Then estimate the source alone:
Important: this correction only makes sense if by a reasonable margin.