Capital Boom, Bust, and the Durable Models (1997–2003)
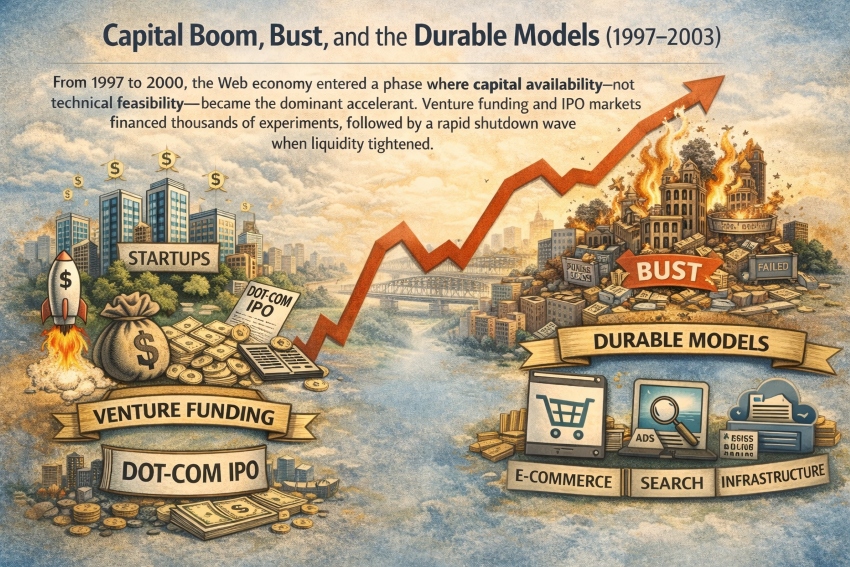
From 1997 to 2000, the Web economy entered a phase where capital availability—not technical feasibility—became the dominant accelerant. Venture funding and IPO markets financed thousands of experiments, followed by a rapid shutdown wave when liquidity tightened.
Sources
- OECD
- NBER
- Reuters
Capital acceleration: venture capital and IPO markets
A practical way to quantify the injection of money is to track major capital channels rather than attempting an impossible census of “all web projects.” One OECD policy review reported roughly USD 145 billion invested into Internet-related applications across 1995–2000.
Sources
- OECD
An NBER working paper documented that from Q2 1999 through Q1 2000 there were over 400 IPOs, with more than 70% internet-related, raising more than $33 billion—evidence of how public markets amplified the investment cycle.
Sources
- NBER
A canonical signal event was Netscape’s 1995 IPO, widely treated as a template for the “scale first” financing narrative. Reuters described the debut as 5 million shares priced at $28, closing day-one at $58.25, valuing the company at about $2.3 billion.
Sources
- Reuters
Where the venture money came from
Venture capital funds are intermediaries, so the underlying sources of money matter. An NBER paper (citing NVCA data) describes major U.S. VC funding sources in 1999 as pension funds, individuals, corporations, and insurance companies—meaning institutional pools materially financed the dot-com/Web buildout.
Sources
- NBER
The shutdown wave: why many projects died (2000–2003)
When capital tightened, many ventures failed because they relied on continuous fundraising, faced negative unit economics, or carried high fixed costs without a credible path to profitability.
Sources
- Pew Research Center
A Pew Internet & American Life report (2001), citing Webmergers.com, stated that since January 2000, 555 “significant” Internet companies (those with serious investor funding) had closed.
Sources
- Pew Research Center
- Webmergers.com (as cited by Pew)
Representative failures illustrate common patterns. Webvan is commonly reported as raising more than $396 million in venture capital and $375 million in its 1999 IPO before collapsing under capital-intensive fulfillment scaling.
Sources
- Wikipedia (Webvan)
Pets.com became emblematic of spending ahead of sustainable margins; summaries commonly highlight heavy marketing spend and persistent losses relative to unit economics.
Sources
- Wikipedia (Pets.com)
The macro correction is widely characterized by severe valuation drawdowns; reputable summaries often describe trillions in lost market value as the Nasdaq fell sharply from its peak.
Sources
- Quartz
What generated durable money: the winners’ archetypes
The models that tended to survive and compound were those with scaling advantages and defensible economics: marketplaces (take-rate models), advertising-supported media, and infrastructure providers that benefited from broad-based Web expansion.
Sources
- WilmerHale
Amazon is often used as a reference point for survivorship and later dominance; reporting on its IPO notes it raised $54 million in 1997, providing runway to scale while capital markets remained open.
Sources
- TechCrunch
The clean “trend start”
A defensible start point for the Web’s economic development trend, the strongest candidate is 1993–1995 (with 1995 as an inflection year): open availability reduced licensing friction, early advertising demonstrated revenue potential, and the Internet’s backbone model shifted toward commercial operation.
Sources
- CERN
- WIRED
- Internet Society
- U.S. National Science Foundation (NSF)
- Netcraft
- ACM Digital Library
- OECD
- NBER